“Journalism is profoundly affected by a changing media environment that has contributed to an ever-increasing pace of innovation and a differentiation of media channels and platforms that simultaneously follows and fosters individualized media use. The digitalization of news media has enabled changes in news production as well as in news consumption, both on the level of individual practices and of organizational and social structures” Leif Kramp and Wiebke Loosen, Chapter 9 – The Transformation of Journalism: From Changing Newsroom Cultures to a New Communicative Orientation?
Every day my focus is to understand how data can be useful for journalists and how to give them the best insights. We have data from many sources. Amounts of data are saved each minute and my daily goal is to turn this data in business value. But each business model and each company is different and to build the bridge between the data information and actions is an interesting challenge!
First of all, we need to be clear about the company values and business model. Values such as Truth and Accuracy, Independence, Fairness and Impartiality, Humanity and Accountability are our guidelines. To give quality content to the reader and to avoid clickbait. In the analytics point of view the goal is always measure audience with quality indicators. I believe that to speak with others data scientists, to share some ideas and experiences, to read articles form the experts it’s the best way to understand how to use in an effective way data in the newsrooms. So, here is a compilation of some useful information about the state of the art.
“One of the fundamental problems with analytics is their availability and distribution within the organisation.“
“It is a golden rule of journalism, taught to any news reporter at the beginning of their career – your introduction should grab the reader straight away. If you cannot hold someone’s attention for a sentence, you have no hope of getting them to read the rest of your article…..Inevitably, if the criterion for including the story on the website is determined by the number of clicks, then we’re going down a very dangerous path…..the frustration of readers clicking on a story which promised more than it delivered – has led to new ways to offer content.” in Clickbait: The changing face of online journalism
“The best way to get this data culture flowing through the newsroom is to get everybody involved and nurture an atmosphere where either a journalist goes to his boss and says, ‘Hey, I found this, it’s really strange and I can’t figure it out’, or, ‘Hey! Have you seen this story? It’s doing really well!’
” for analytics to be useful in the newsroom, they need to have been developed with the newsroom in mind….We’re all likely aware of the problems and limitations of single metrics in the industry, and though the cult of the page view appears to be diminishing a little, it’s still a predominant force because quite simply it’s a convenient and apparently universal measure of ‘success’ – whatever that means…..So, while the data – the raw material – is of course essential, it’s the context and insight that data reveals that’s absolutely key. The value comes from aligning data and information with a frame of reference and presenting it thus” in Editorial intelligence: a paradigm shift for newsroom analytics
“The Times and The Guardian, two publishing powerhouses who have recently adopted in-house analytics systems can attest to the take up of widespread analytics usage: having given the option to all journalists, around 1,300 at The Times and 900 at The Guardian are now using them. No doubt each journalist and editor has different questions to be asked of the data and need it for different reasons, but that can only be a good thing. A writer who is producing longform investigative articles is likely to be seeking different answers from their data than someone writing celebrity stories.” in Editorial analytics and the democratization of the newsroom
In the article What I learned from seven years as the Guardian’s audience editor Chris Moran share some interesting leanings. This are the notes that I took from the article:
“Whatever role you play in a news organisation, data should be critical to you. …..the fact that it’s easy to come up with thousands of reasons why it would be legitimate or essential to do the opposite of the most obvious response to the data means that we cannot pass responsibility on to an algorithm with any confidence. We are always at our best when data is used to inform rather than lead the editorial process…….Data isn’t always the answer to a specific question. We need to be careful about framing the questions we ask in a way that skews the data. We need to be clear about where our data is partial. We can’t expect to use historical data to predict a very different future…..We should all be spending more time looking at time spent…..Asking pretty simple questions about the audience for a piece and the way it will reach them should be at the heart of every commissioning decision.”
So, what are the metrics, the KPI’s?
In this business context we can group KPI’s by sections: audiences, marketing and sales. They are related of course! If we increase engagement, we increase customer retention and consequently increase subscriptions! We start by audiences KPI’s for analyse how to measure the article performance and then we will see how to analyse the customer loyalty. Nowadays we have dashboards that coupled audience metrics and business metrics in order to understand wish kind of content/author/subject engage more and also converts more subscribers.

“The most successful newsrooms are the ones that talk a lot together, and having good information and data at your fingertips makes those conversations particularly productive.”in Editorial intelligence: a paradigm shift for newsroom analytics
-
The article performance
We can measure the article performance in order to evaluate if a piece of content had good level of engagement taking account some variables: the type of content (a short history of long-form), hour of the day published, traffic sources and devices, etc.
According to ecirculation is a key metric for news publishers in 2018. In his article Andrew show us the importance of recirculation for measure the reader engagement. Recirculation show us the percentage of readers who visit another page of our website after they finish reading their first article.
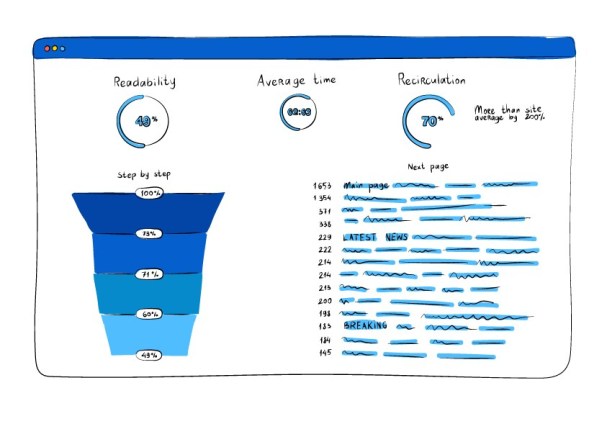
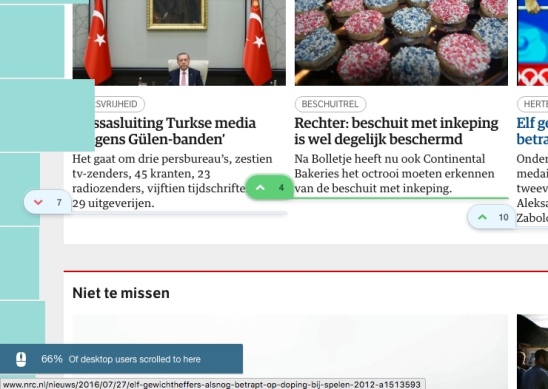
Another important metric is Readability also called scroll depth it “measures how thoroughly your audience digests your content by tracking where most people finish reading each individual article.”
We built a score that combines three metrics: avg. engaged time, quality clicks (quality click is one where the person who clicked through onto that story subsequently spent 15 seconds of engaged time consuming that story) and unique users. The goal was to have a ranking of those articles that had most readers, that generate more quality clicks and where readers spend more time. Combining three metrics and we have a more informative ranking.
Die Welt built the article score that “takes into account five different elements, which are all weighted differently. Number of visits to an article can have a maximum score of 10,
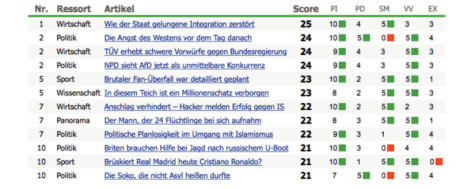
while engagement time, percentage of social media traffic, the number of video views and the bounce rate can only get up to five points each. …Using Article Score has changed Die Welt’s approach to digital content and has improved engagement.”
“We wanted to build something that gives editors clear indications instead of them having to go through a bunch of Excel files and see how their stories did compared to the previous week.”Kritsanarat Khunkham, Die Welt
VG+ is another interesting example of successful use of analytics in the newsroom. “At VG, breaking news is available for free and is supported by ads on our popular Web site. Premium content is also promoted through the same site and is interspersed among free and open content. Data insight helps determine what content we promote, taking both the commercial and editorial requirements into consideration.

Live data displayed on dashboards used by the editorial department helps determine how long to promote a story, what row on the front page will have the most impact, what stories convert to new subscribers, what stories have high churn, and engagement metrics like session length and time spent consuming content. We have also used insight to determine which of the older stories we can promote again and again. A high-converting old story that is not time limited can be promoted multiple times as long as it’s still relevant. Funnel analysis and A/B testing of features helps to optimize the product and improve the performance of our authentication system and paywall…..One of the key turning points was in getting journalists who traditionally only published in print to think about how their stories would be published digitally from the moment they began planning a new story. ”
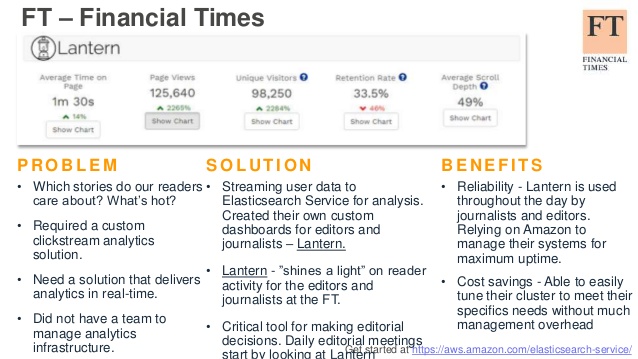
In the FT: “to facilitate the understanding and the awareness in the newsroom of metrics and performances, the organisation is developing a new bespoke dashboard, called Lantern, a name picked for a tool that is meant to be ‘illuminating’ and user-friendly for journalists. It translates performance into measures that are meaningful to journalists and editors, moving away from the dominance of pageviews, and towards newer integrated metrics of engagement that take into account things like time spent, recirculation, volume of articles read per visit, and number of comments” in Editorial analytics and the democratization of the newsroom
2. The engagement metric of FT
The FT metric focused in loyalty and frequency based in the model RFV (recency, frequency, and volume) looks the last 90 days to see how recently a reader visited FT, how many times and how much he read over the period. This metric provides a useful way to segment readers (an approach developed in the past in our newspaper can be seen here).
“A key aspect of making any metric useful to editorial is making it real-time, so we need to figure out a form of RFV [recency, frequency and volume] that can do that. They need to be able to make decisions quickly, on the spot, and RFV should help with that.”
3. Subscriber retention analysis
An interesting approach with survival analysis. “In the application of this approach to the publishing industry, I was interested in predicting how long a subscriber would remain active as a customer. The “failure event” to be predicted in healthcare economics is a patient’s death. In my models for publishers, it was a cancelled subscription. Using survival analysis, it was clear price increases played a role in a subscriber’s likelihood of stopping, but the effect of price was very different across the customer base. ……. A powerful aspect of regression models, including survival analysis, is that it can measure the effects of important factors on subscriber retention in isolation. Once these models have been developed, predictions can be made on the number of accounts that will stop due to a renewal price increase and who is most likely to stop. Using A/B testing with no-increase control groups to validate the accuracy of the model predictions is the best way to establish a closed-loop pricing and retention optimization process where insights from price changes are incorporated into future changes, thus improving the efficiency and performance of the pricing strategy…..Several predictive metrics are consistently important in our models of print and digital subscriber retention. …consumption, interaction, attitudinal, time, and socio-economic categories…” By
More interesting information!
- 9 reasons why your analytics fail in the newsroom
- Three examples of machine learning in the newsroom
- The Audience-Oriented Editor
 This study investigated the influence of online audience metrics on editorial decision-making. It found that to some extent, editors are willing to adjust their editorial decision-making based on web metrics. This willingness is influenced by their perceived economic benefits of getting readership.
“The Washington Post, for example, detailed web metrics are displayed on a television
screen for the entire newsroom. Editorial staff at The Post also receive emails everyday
with specific data on web traffic. In other news organizations, web metrics have become
important indicators of how well newsrooms perform (Peters, 2010).”
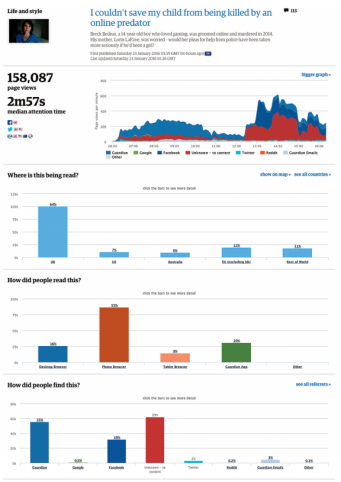
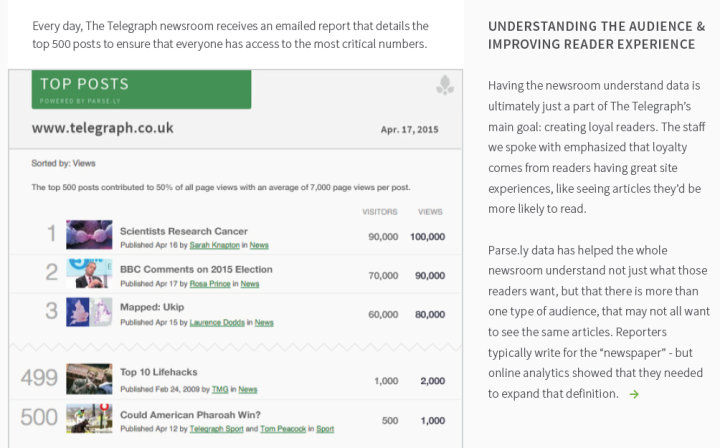
Another example, The Telegraph case study using Parse.ly. Their highlights. Democratizing Data in the Newsroom, Connecting Web Best Practices with Success, Uncovering Contributions Based on Data Understanding Audience Actions and Optimising Sponsored Content.
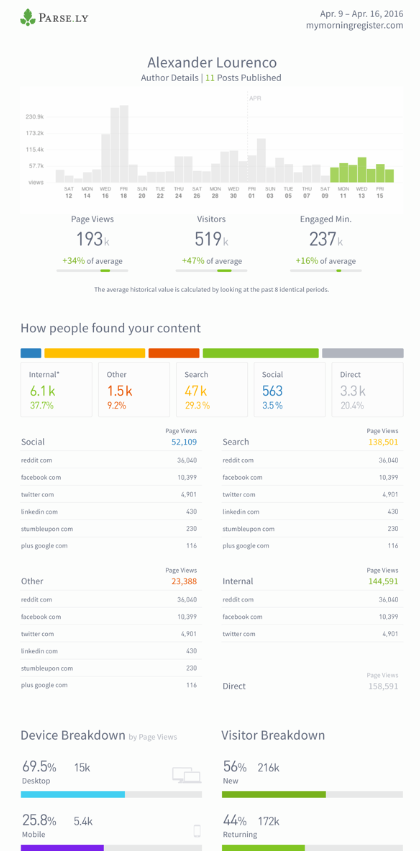
An example of an author dashboard: